Water Seismic
3 cups
Blueberries
Power
Block
235 meter
Cabel
Cable laying
Boat
Cable and Instrument
boat
3 cups
Blueberries
235 meter
Cable
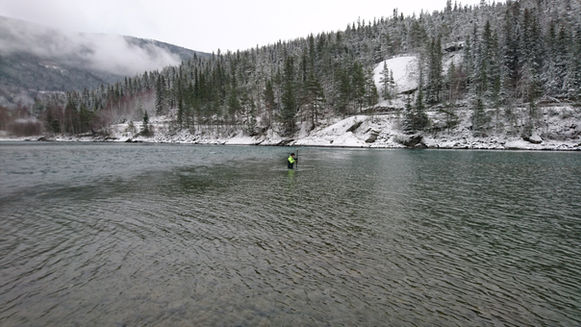
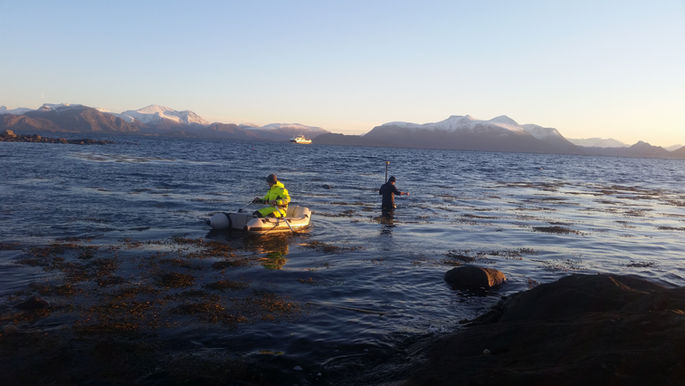
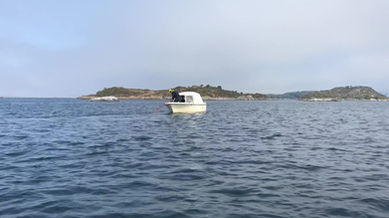
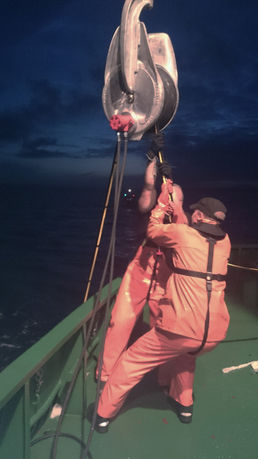
Seismic on water
provides quick and reliable solutions for infrastructural planning on water.
Inventory of hydrophone cables
With our 235 meter and 475 meter long cable, we are able to offer refraction seismic services on water upto 300 meter water depth. Furthermore, with our 115 meter long cable we deliver solutions in shallow and fresh water.
470 meter
cable
Explosives at
every 50 meter
48
hydrophones
3 cups
Blueberries
Our team
has been providing services on sea and fresh water in order to solve complex challenges in demanding circumstances.
Short explanation of the method
The method is based on registering the seismic waves that refracts from the geological layer boundaries that are attributed with different velocities. A prerequisite for applying this method is that the seismic velocities increase as the depth increases. However, the seismic velocity normally increases downwards due to consolidations and water saturations. The seismic velocities vary from 400 m/s in dry, loose sand up to 6500 m/s in unweathered diabase/gabbro.
The lower rock velocities can be obtained in more or less vertical shear zones in the bedrock or in upper, weathered and / or fractured layers overlying the solid, unweathered rock.
For infrastructural planning purposes and water prospecting, the in-line, continuous profiling system is generally used, i.e., the impact shot points and the detectors, geophones or hydrophones, are in the same line. The 24 or 48 hydrophones are placed in a straight line along the water seismic cable and the instruments are placed at the end of the hydrophone spread.
Special water bottom cables with hydrophones and connection points to the pre-loaded shots are used for surveys on the water.
-
A cable of 115 meter active length with 5 meter hydrophone distance is used when the water is calm and shallow and the sediment thickness is moderate.
-
For more advanced surveys, a cable of 235 meter or 475 meter active length is used
The procedure
The principle behind a seismic survey is to generate an elastic wave (shock wave) at a certain point and in a number of other points where the arrival time of the wave front that has traveled through the various layers in the ground. With the help of geometrical calculations, it is possible to determine the seismic velocities and thickness of the different layers. In the case of refraction seismic, the most interesting part is the arrival time of the first part of the wave front.
To be able to map out the weakness zones in the bed rock, the orientation of the profiles in regards of the zones and geophone/ hydrophone spacing is crucial. The seismic data detects weakness zones in the bed rock surface but it does not provide information about the angle of the weakness Zone.
The idealised travel time curve allows reliable determinations of depth and velocities. The true depth can be calculated using either the intercept time or the critical distance. However, in reality, the interpreter will encounter distorted travel time curves and the seismic data give apparent velocities, intercept times and critical distances. The distortion of the curves is due to variations in thickness and number of sub-surface layers and varying elastic properties in the layers.
In order to solve the interpretational problems, the recorded travel times have to be corrected through mathematical developments.
Quality ensurance model
The geophysical data interpretation is carried out in two waves in order to ensure quality and reliability in our results presented.
The manual interpretation is based on the ABC method that is fed by the observed geophysical and geological data. This method gives a layered model of the geophysical features of the Earth's sub-surface and present the layer boundaries and bedrock curve along the seismic profiles.
Parallel to the manual interpretation, we also carry out a software based interpretation of the geophysical data that is presented in an inversion model. The inversion model gives a good visualisation of the geological structures that is calculated by using the Shortest Path method based on Graph theory.
Concluding the interpretation process, we create a combined model by aligning and comparing the two methods against each other, therefore, ensuring quality and reliability in our results.


